Loadings with scikit-learn PCA
Loadings with scikit-learn PCA
The past couple of weeks I’ve been taking a course in data analysis for *omics data. One part of the course was about using PCA to explore your data.
Principal Component Analysis in essence is to take high dimensional data and find a projection such that the variance is maximized over the first basis. Then finding a second basis which is orthogonal to the first basis and maximizes the variance given that. And so on for as many components as one wish to explore.
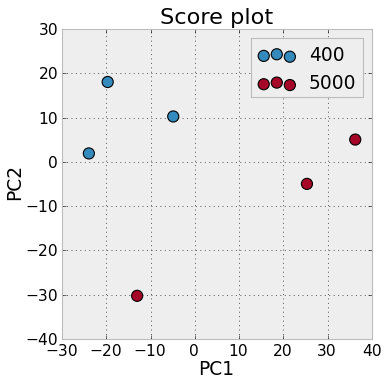
The bases are reffered to as ‘principal components’, and the projected data points to the principal components are called 'scores’.
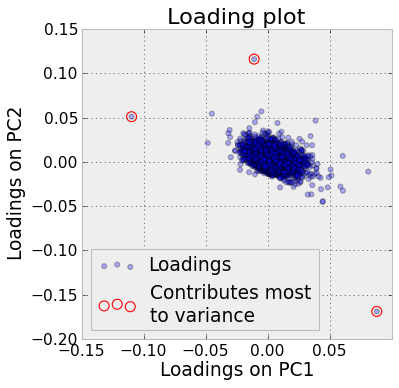
One can also find the data points distances from the vectors that becomes the new basis vectors. This is referred to as 'loadings’, and gives and idea of which basis in the original data contributes to the greatest variance in the scores.
For the course we were instructed in various analysis suites with all sorts of GUI’s and predefined analysis. I however felt that this was a perfect excuse to finally get some experience with Pandas and scikit-learn.
So just imagine I have some data in the DataFrame data. This is how you do a
PCA for two components with scikits-learn and plot the result.
Very intuitive and tidy. However, the problem comes when one wants to look at
the loadings. Most packages, for example R, will give you the loadings as
well as the scores. Here the only things we get are these:
pca.components_
pca.explained_variance_
pca.explained_variance_ratio_
pca.mean_
(In scikits-learn, fields ending with _ are fields that where generated by
training/fitting.)
Looking under the hood of PCA, on GitHub, reveals that the
fitting PCA.fit method is just a wrapper for PCA._fit(), which returns the
PCA object itself to allow for chaining method calls. The _fit() method
performs a SVD on the data matrix, and sets the field pca.components_ to the
first n_components columns of the right singular matrix. The rows of this
new matrix will be the Loading points!
Thus we can plot the loadings in this fashion