Policy under spatial constraints
A few years ago we published a paper on SpatialDE, a method to identify genes which follow spatial patterning in tissues measured with spatial transcriptomics methods. Methods for measuring entire transcriptomes in spatial context have exploded in the last couple of years, including the release of commercial platforms such as Visium or Xenium instruments from 10x genomics and the MERSCOPE instrument from VizGen. Hopefully SpatialDE will be useful for users of these methods.
SpatialDE also comes with the automatic expression histology (AEH) method which identifies global spatial structures in tissues which explain the expression of a number of spatially covarying genes.
When encountering a type of data you are not familiar with, the first thing you do is first think of the question you want to answer from the data. Secondly you look for analysis methods to make use of the data. It appeared that the form of data in spatial transcriptomics data was unique. Spatial statistics is a classical field with many well developed theories and analysis methods, but what to do when measuring thousands of variables over spatial coordinates had not been explored. So we were led to develop our own method for analysis, and a particular question we wanted to address was how to find spatially constrained patterns of gene expression. But are there other cases than histology where this form of analysis can be interesting?
One case could be spatially constrained policy. There are many cases where geographical regions for cultural reasons have different ideas of what a government should or shouldn’t do. This could directly fold into an effective definition of a country, a topic that often arises in the Caltech Sovereignty Club, a discussion club on international politics and history. In representational democracies, votes on bills by representatives from spatially defined regions can act as a proxy for the opinions of the regions. The bills are analogous to the “genes” and the geography of the country becomes the “tissue”. Can we identify cultural geographical divides from the voting records of representatives?
In 2016, the US house of representatives, which consists of 438 districts, voted on 621 bills. The spatial geographical information of the districts can be downloaded from http://cdmaps.polisci.ucla.edu/ (districts114.zip) as Shapefiles.

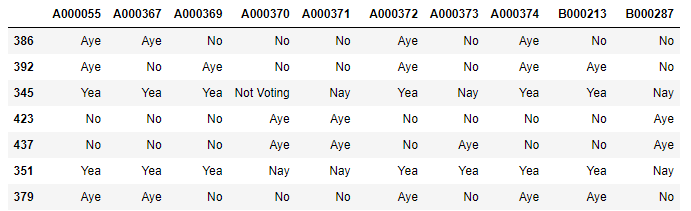
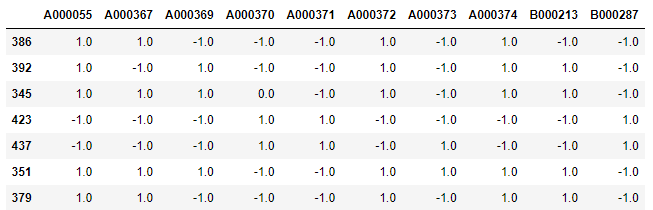
We can use the longitude/latitude coordinate centroids of the districts as spatial locations. Roll calls for each bill are made available at pages such as for example http://clerk.house.gov/evs/2016/roll621.xml for the 621st bill. All the XML files for bills can be downloaded and easily parsed to extract which representatives voted ‘yes’, ‘no’, or did not vote on the bill. We can encode these values as 1.0 for ‘yes’, -1.0 for ‘no’, and use 0.0 for the abstained votes.
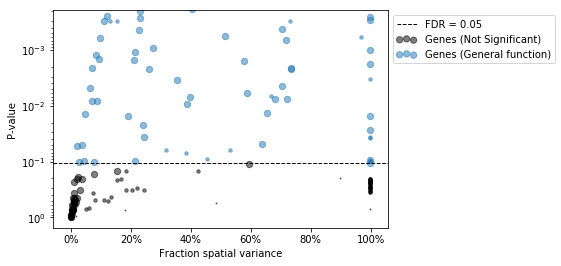
Of the 621 bills, 521 are significantly correlated with spatial location. We fit the AEH model to these bills, asking for 3 spatial functions to explain variance, and a spatial length scale of 7 minutes (about 800 km).
The AEH model will group the bills into three categories, such that if you know the spatial coordinate you can predict the vote for the category. The full model for the 521 modeled bills and the three categories can be written as
$$ \begin{aligned} P(Y, \mu, Z, \sigma^2, \Sigma) &= P(Y | \mu, Z, \sigma^2) \cdot P(\mu | \Sigma) \cdot P(Z), \\ P(Y | \mu, Z, \sigma^2) &= \prod_{k = 1}^{3} \prod_{b = 1}^{521} \text{N}(\mu_k | 0, \Sigma), \\ P(\mu | \Sigma) &= \prod_{k = 1}^{3} \text{N}(\mu_k | 0, \Sigma), \\ P(Z) &= \prod_{k = 1}^{3} \prod_{b = 1}^{521} \left( \frac{1}{3} \right)^{z_{b, k}}. \end{aligned} $$
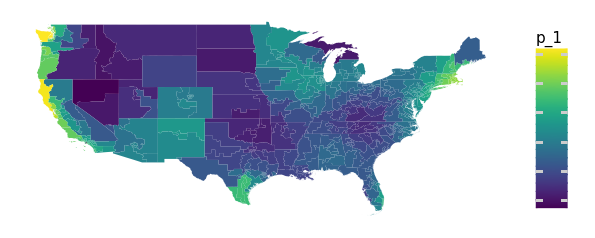
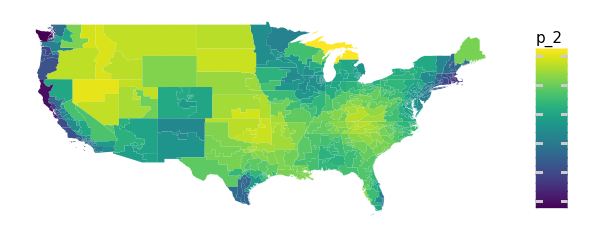
After the variational inference for the AEH model reaches convergence, we have three smooth functions over coordinates corresponding to bill-to-function allocation in the matrix . The interpretation is that if a function has a high value at a spatial coordinate, it means that that coordinate is likely to vote ‘yes’ on the bills that were assigned to the function.
Results
Pattern 1
Assigned bills (top 6):
Justice Against Sponsors of Terrorism ActAnti-terrorism Information Sharing Is Strength ActHousing Opportunity Through Modernization ActFair Investment Opportunities for Professional Experts ActExpressing the sense of the House of Representatives to support the territorial intergrity of GeorgiaTo direct the Secretary of State to develop a strategy to obtain observer status for Taiwan in the International Criminal Police Organization, and for other purposes…
Pattern 2
Assigned bills (top 6):
Accelerating Access to Capital Act of 2016Satisfying Energy Needs and Saving the Environment ActVA Accountability First and Appeals Modernization ActClarifying Congressional Intent in Providing for DC Home Rule Act of 2016Regulatory Integrity Act of 2016Motor Vehicle Safety Whistleblower Act…
Pattern 3
Assigned bills (top 6):
Providing for consideration of H.R. 4361, Federal Information Systems Safeguards Act of 2016Providing for consideration of H.R. 2745, the Standard Merger and Acquisition Reviews Through Equal Rules Act of 2015; and providing for proceedings during the period from March 24, 2016, through April 11, 2016Iranian Leadership Asset Transparency ActEnergy Policy Modernization Act of 2016Providing for consideration of the bill (H.R. 5325) making appropriations for the Legislative Branch for the fiscal year ending in September 30, 2017, and for other purposesExpressing the sense of Congress that a carbon tax would be detrimental to the United States economy…
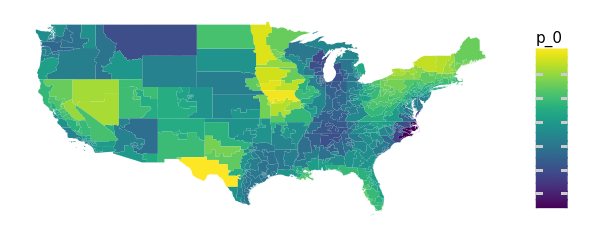
For example, the two bills “Justice Against Sponsors of Terrorism Act” and “Anti-terrorism Information Sharing Is Strength Act” are both assigned to the first function. First, this means that support for these two bills is spatially correlated; in a spatial location where one bill is supported, the other is also likely to be supported. (In this particular case the names of these bills alone makes this pretty plausible). Secondly, this means that if we evaluate the first function on a map of the US, we can locate which spatial regions support these bills.
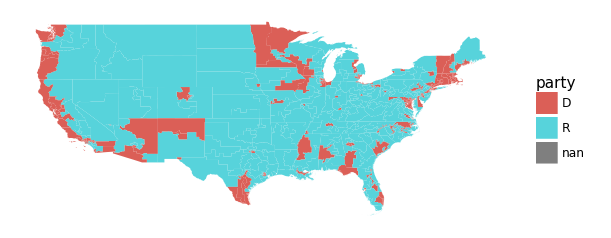
The spatial functions can be used to segment the country into spatially smooth regions where the house members largely agree on issues. For each house district, we can evaluate the three spatial functions and obtain the largest value. The identity of the spatial function producing the largest value defines which spatial region the house district belongs to.
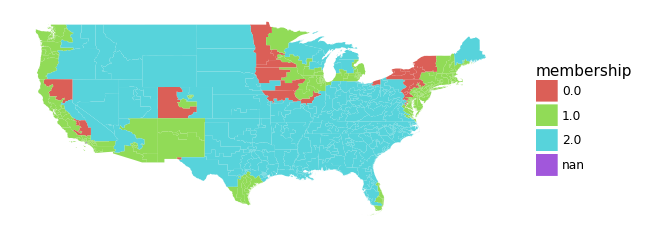
This largely coincides with party affiliation of the house members from the districts.
Though we have obtained spatially constrained regions with similar political opinion, this is not optimal. Ideally the model would identify regions which are spatially connected, to avoid forming enclaves or exclaves. How to define a similar model which satisfies such connectivity constraints might be an interesting follow-up research project.
Jupyter notebooks and data for this post are available here.