Identify tissue structure with Automatic Expression Histology
A while after the invention of the microscope, scientists started applying various chemical dyes when looking at biological samples in the form of tissues from diseased organs. This revealed anatomical structures on the microscopic scale in many plant and animal tissues, birthing the field of histology. Microscopy of stained tissue is still an enormously important field, and histopathologists have devised metrics for diagnosing many types of conditions and diseases based on patterns of cells in stained tissues.
The original classification of the six neuronal layers in the cerebral cortex for example was made on the basis of morphology observed using “Nissl staining” which highlights the endoplasmic reticulum.
Since the original studies of brain microanatomy in the late 19th century we have figured out that the functions and phenotypes of cells (including neurons) are determined by regulation of gene expression programs. Many histological assays are now defined by examining particular gene products examined using immunohistochemical assays.
Researchers are now making extremely rich molecular measurements with preserved spatial coordinates in tissues. At the same time as genome wide measurement are being miniaturized into technologies that preserve spatial location in tissues, technologies for counting individual mRNA molecules in cells using imaging are being increasingly parallelized. We are reaching a point where these two approaches to spatial gene expression analysis are converging to similarly rich assays, with the ability to look at thousands of gene products in thousands of individual cells in tissues.
Similar to how pathologists have defined visual morphological “markers” for cell types in tissues, it is possible to look directly at gene expression or protein abundance throughout the tissue to learn about its structure.
The function of regions of tissues will in many cases be determined by sets of co-expressed genes. This means there is a coupling between spatial locality of function and particular sets of genes.
The automatic expression histology (AEH) model which we published in Nature Methods earlier this year attempts to explicitly model this coupling through a probabilistic model:
Here Y is a set of vectors of G genes observed in N locations in the tissue. The first couple of equations just describe a probabilistic model of clusters: a Gaussian mixture model with K components. Here the matrix Z is binary, and only has one non-zero entry per row which assigns an observation to a component. The last two lines though specify that means in the GMM should be generated from smooth spatial functions, thus giving the form of a mixture of Gaussian processes. The covariance matrix Σ encodes spatial locality.
Modeling the spatial functions with Gaussian processes means you do not need to know what they look like, we just assume they are somewhat smooth.
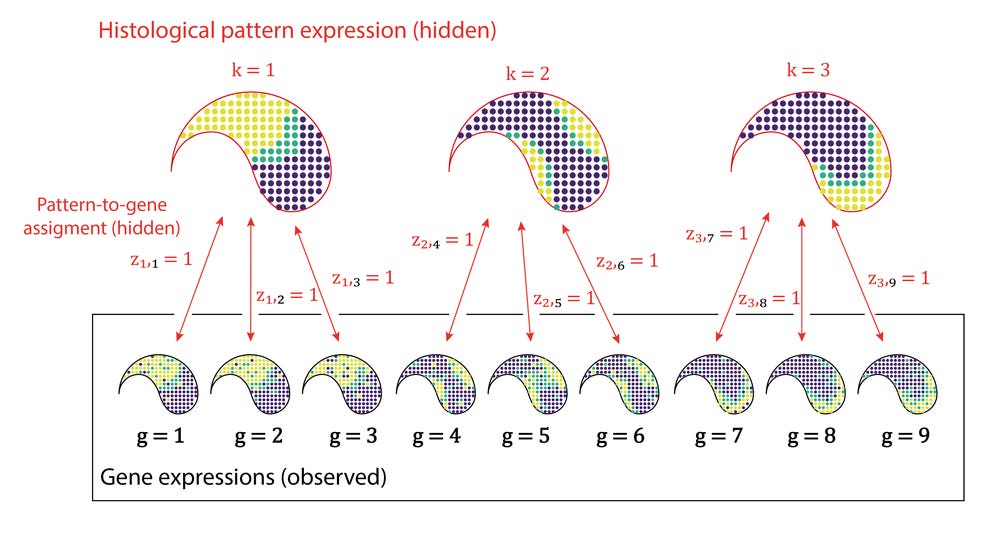
In this model the expression levels of genes are governed by underlying shared spatial functions. The information we know from the experiment is Y and Σ. We don’t know what the functions look like (μ and σ) and we don’t know which genes share which function (Z).
This figure gives a visual representation of the idea of how the binary matrix Z assigns genes g to underlying patterns k:
Implemented in the SpatialDE package there is a Bayesian inference algorithm for learning posterior probabilities of the assignments z between genes and hidden spatial patterns that, together, give rise to spatial co-expression. In our paper we applied it to breast cancer tissue and found a set of immune genes spatially co-expressed in a region of tumor infiltration. We also applied it to mouse olfactory bulb data and got a clear picture of the layer structure of the organ. As well as spatial organization of cell types in a small region of mouse hippocampus.
As a new example here, we can apply the method to an extremely interesting recent dataset that was produced using the novel STARmap technology. This protocol uses in situ DNA sequencing to decode barcodes bound to mRNA molecules within cells of a given tissue, integrating the concepts of CLARITY tissue clearing, in situ FISSEQ, and seqFISH/MERFISH combinatorial gene tagging.
The dataset we use here as an example probed 1,020 genes in in 1,549 single cells over a region of size of about 700 µm by 400 µm in the primary visual cortex of a mouse (corresponding to Figure 4 in the STARmap paper).
First we run the SpatialDE significance test, and find that 101 of the genes significantly depend on spatial locations of the cells in the tissue. To perform AEH, we use these genes and set the characteristic length scale in the tissue. Setting these parameters is not trivial, and here we are a bit helped by domain knowledge. We happen to know that layers are on the order of a couple of 100 µm, and we expect about eight of them. We then set the length scale to be 100 µm and select eight underlying spatial patterns to assign the genes to.
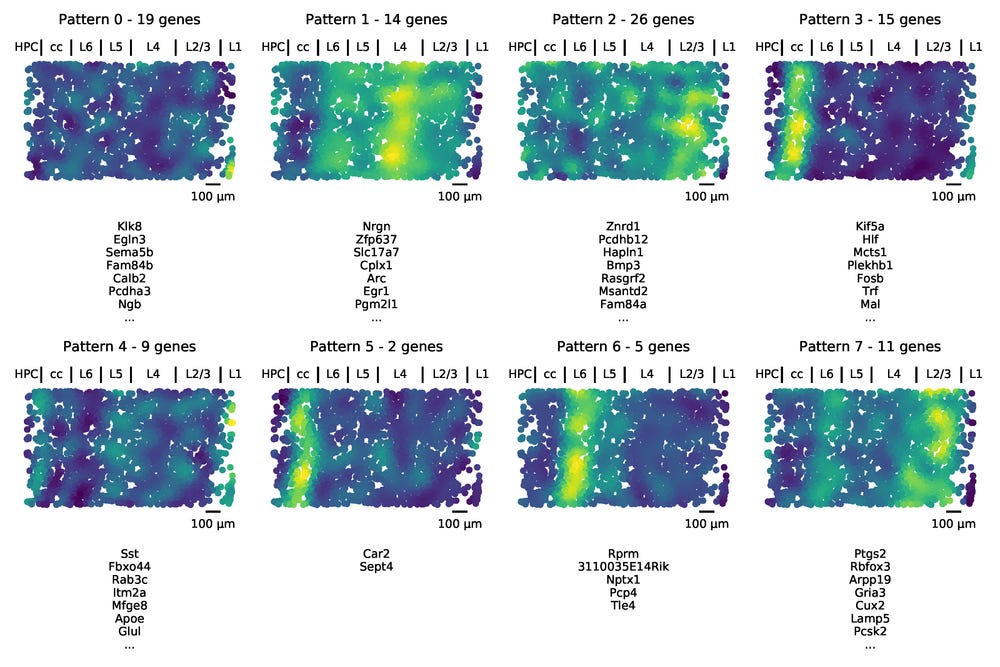
After running AEH we are given assignments of the genes, as well as the underlying spatial function for a pattern, which is evaluated for all the cells in the dataset/tissue.
Approximately annotating the image by matching it with the figure in the STARmap paper, we see that the patterns learned by AEH match up with the classical layers of the cortex. While we used the number of layers when running AEH, no information about the structure of them were provided to the model. The layer structure that was originally observed by the morphology of stained cells was now automatically identified by the molecular measurements. One way of viewing this is that we now have access to 101 “colors” from the genes, and the “hues” we get by mixing combinations of them in the different layers form patterns that are easy to see computationally.
Compared to other spatial data this dataset is on the larger side, measuring 1500 locations, but even so AEH converges in a reasonable time. Of course the data sets will get larger, but seeing these technologies spread to more research labs is going to be very interesting. The same way many cell types have been discovered by single cell RNA sequencing, many new microanatomical structures will be discovered in many organs using these spatial gene expression methods. I hope tools such as AEH in SpatialDE will be helpful to the fields of tissue and cell biology.
The analysis of the STARmap data can be seen in a Jupyter notebook here.
Thanks to Carlos Talavera-Lópes for feedback on the post.


